

If you’re new to Google Analytics, most likely your account will be set-up with G4 analytics. But all previous Universal Analytics accounts will be moved to G4 by July 1st 2023. But if you’re still using Universal Analytics here’s a guide to it too
G4 Analytics
G4 analytics tracks how users interact with your website or app. It shows sources, numbers, locations and more. So you could make informative marketing and business decisions.
Quick set-up guide
Have you installed and prepared your G4 analytics? If not, here’s a guide to it
Here are some mini step by step guides to help you explore some of the GA4 features
The new analytics made it easier to track everything all in one place.
You can view a brief overview of your analytics by clicking ‘Report - Report snapchat’.
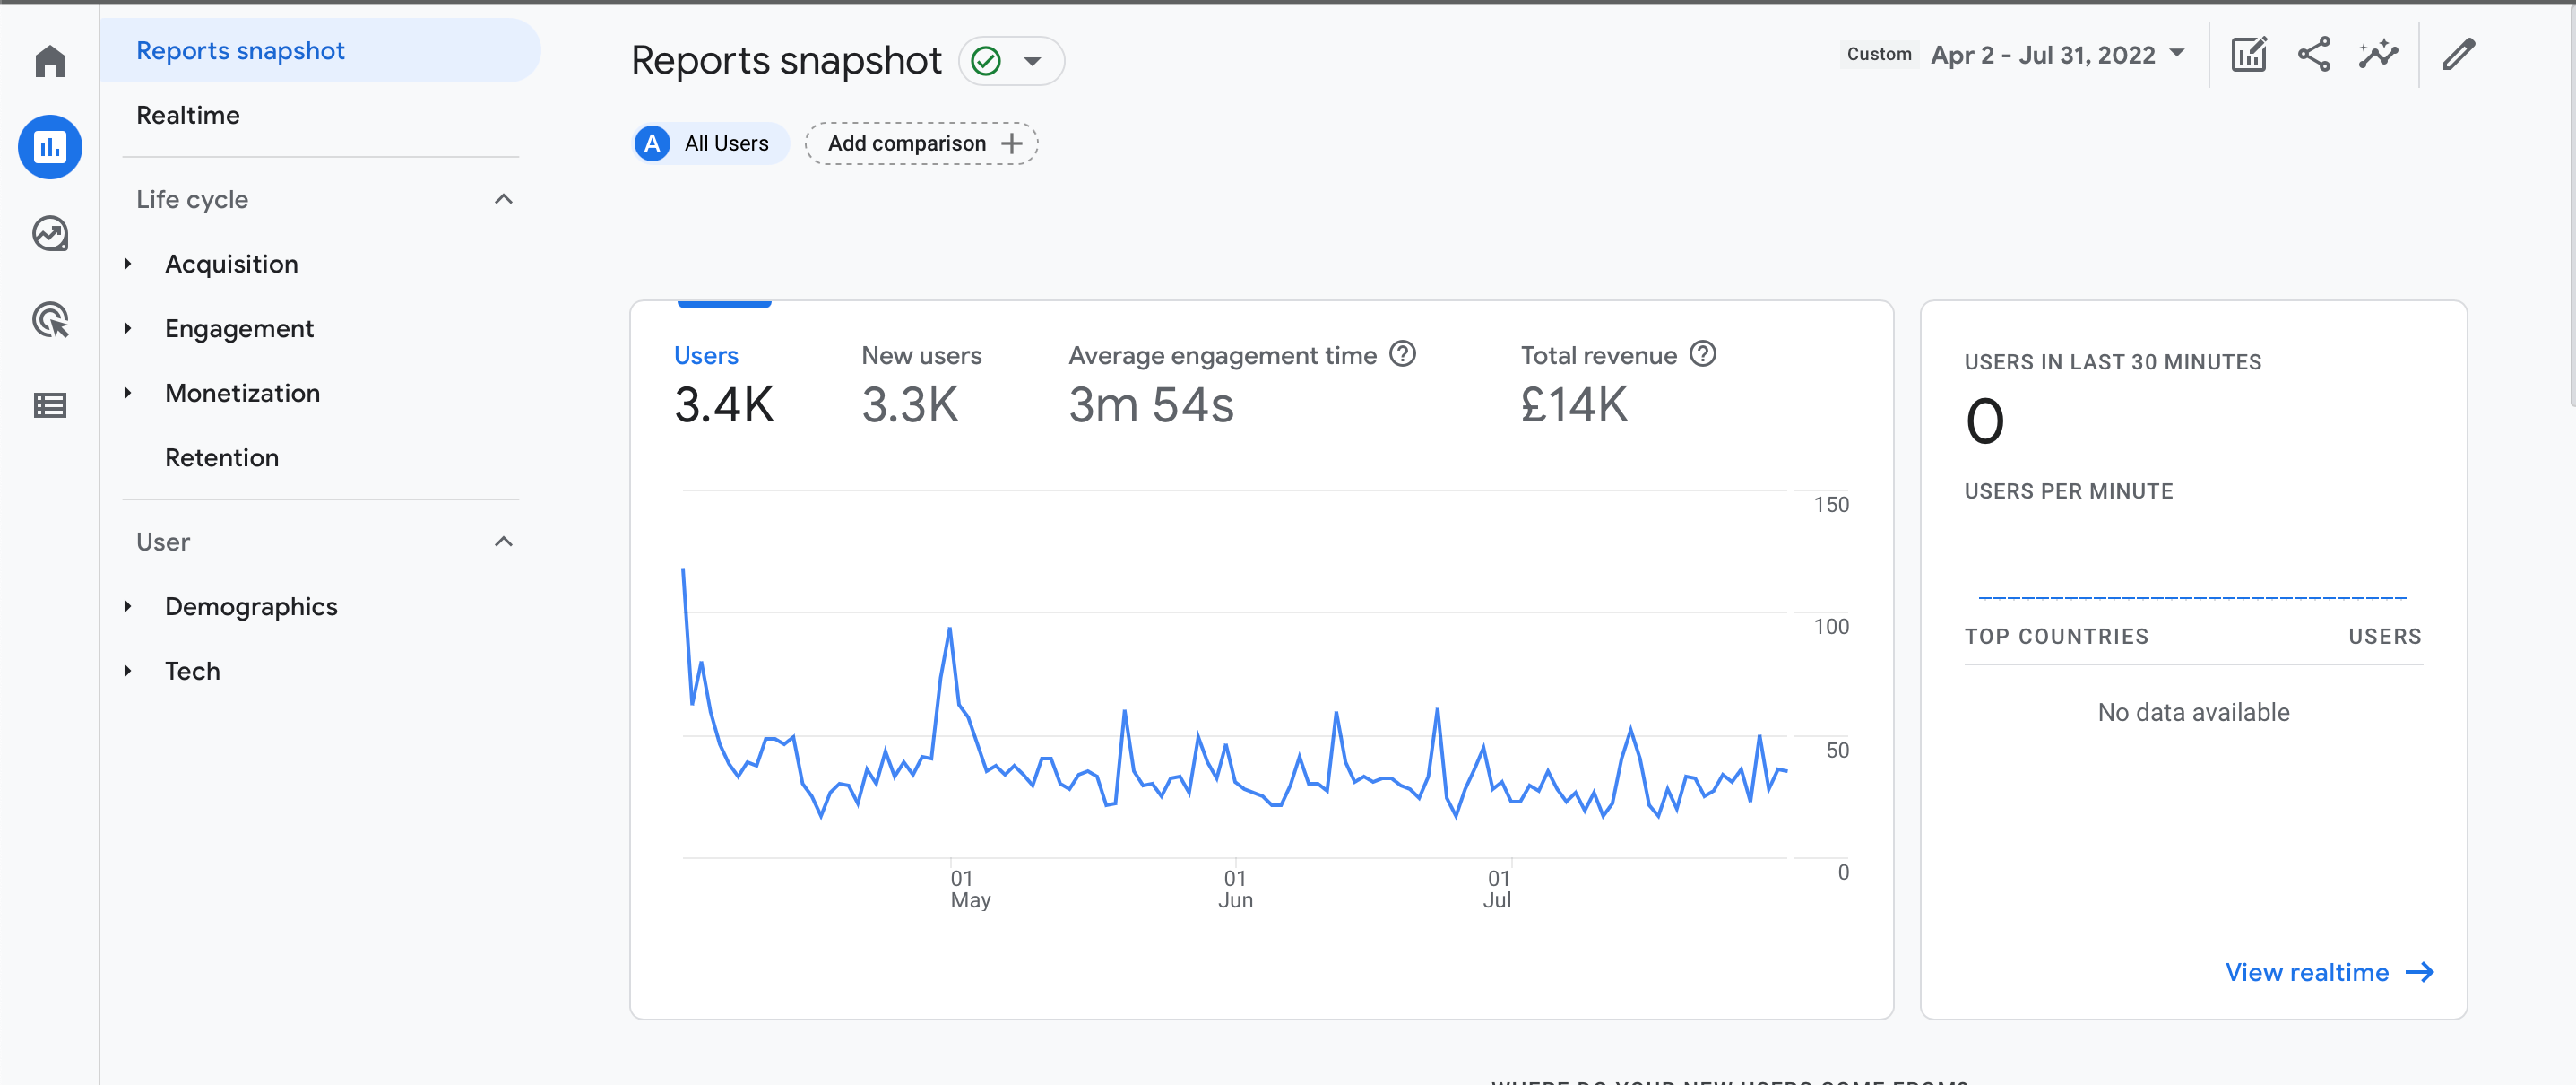
You can Set the desired timeframe you want to look at by editing the dates up the top left. This area will also allow you to compare your analytics against previous timeframes.
Overall, the reports snapshot provides main metrics from your website or source which includes:
- Users - total of number of users that visited your website/app over set period of time
- New users - users that visited your website for the first time (usually less accurate, as it’s highly based on user cookie information)
- Average engagement time - how long a user spent on the website/app on average. A basic session length
- Total revenue - how much revenue was generated over a set period (if it’s an ecommerce platform). If it’s not an E-commerce platform it can track value assigned options. More on that you can find here - A guide to tracking “thank you” page
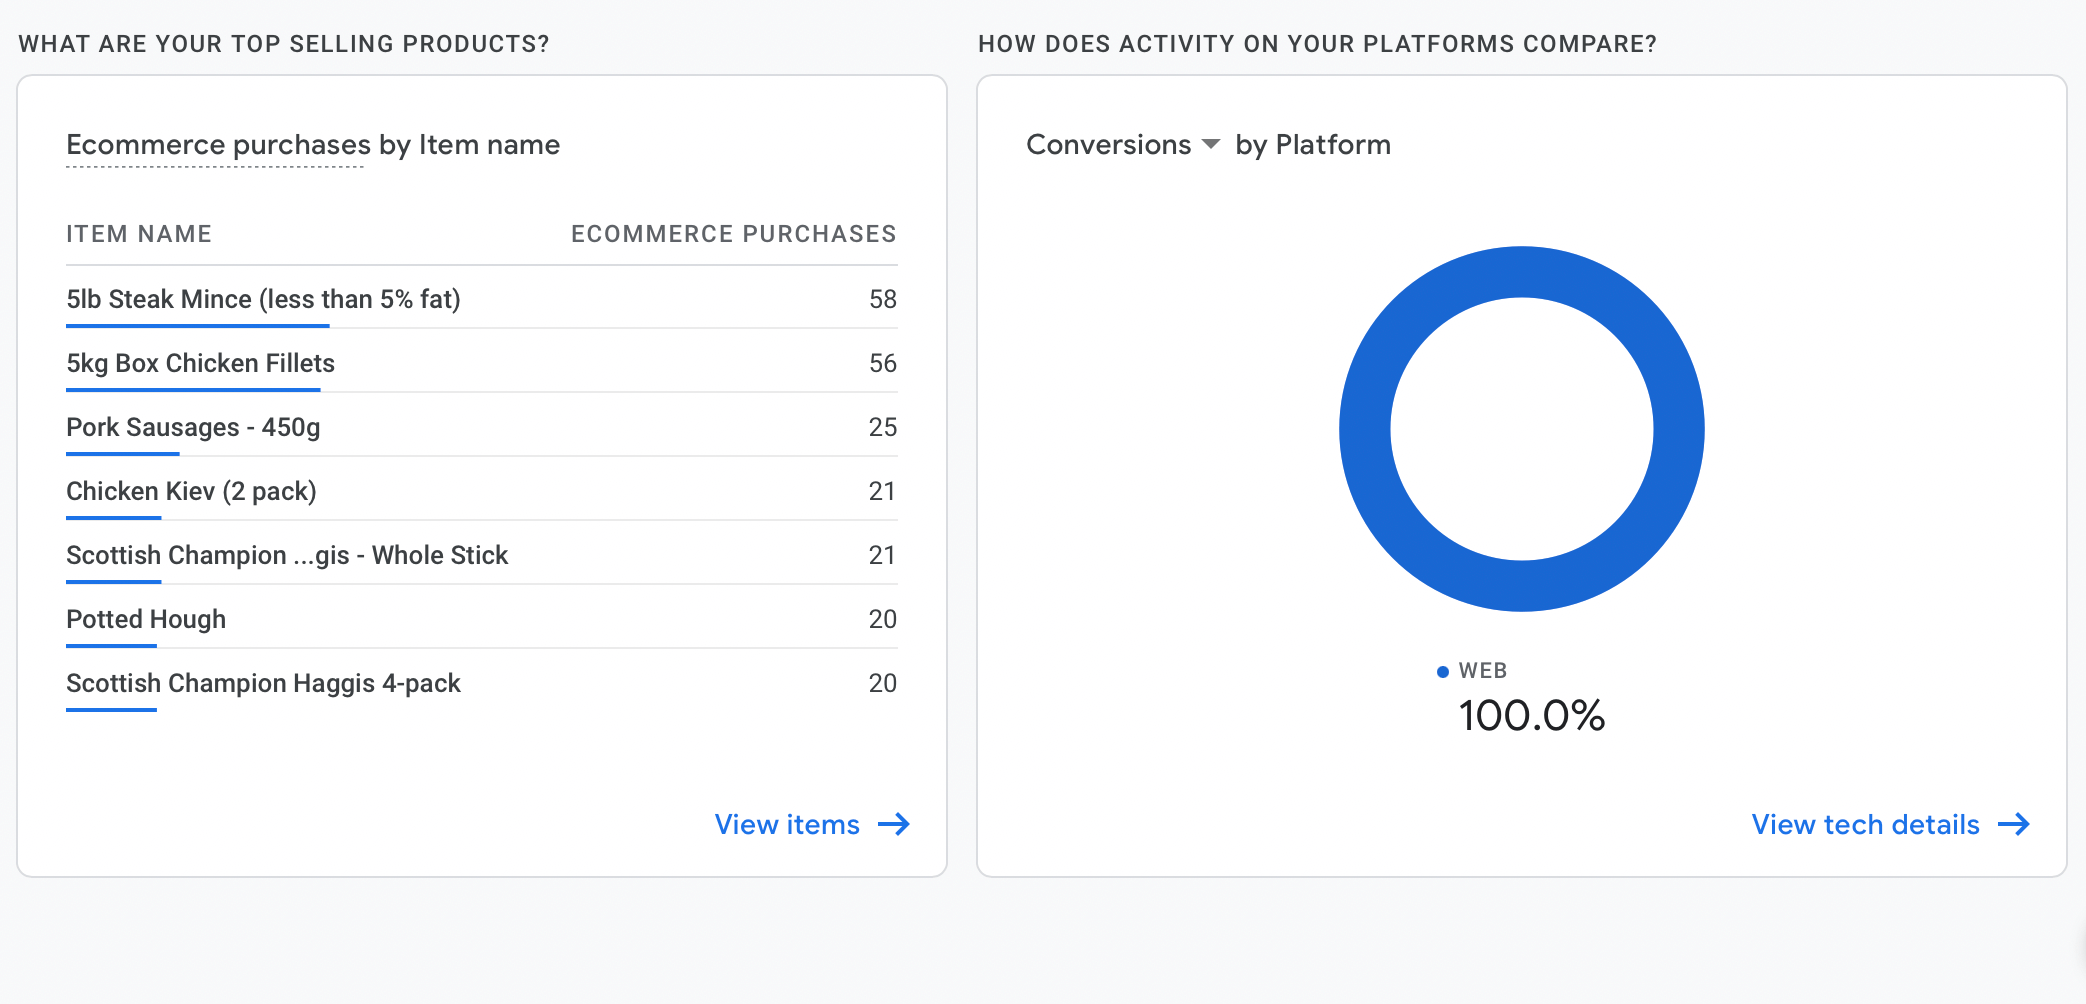
If you run an e-commerce store. You can see below the performance of your products, including:
- Views - most popular products viewed by potential customers
- Add to carts - see how many users add your product to cart after viewing it
- And purchases - how many users progress with the purchase and checkout
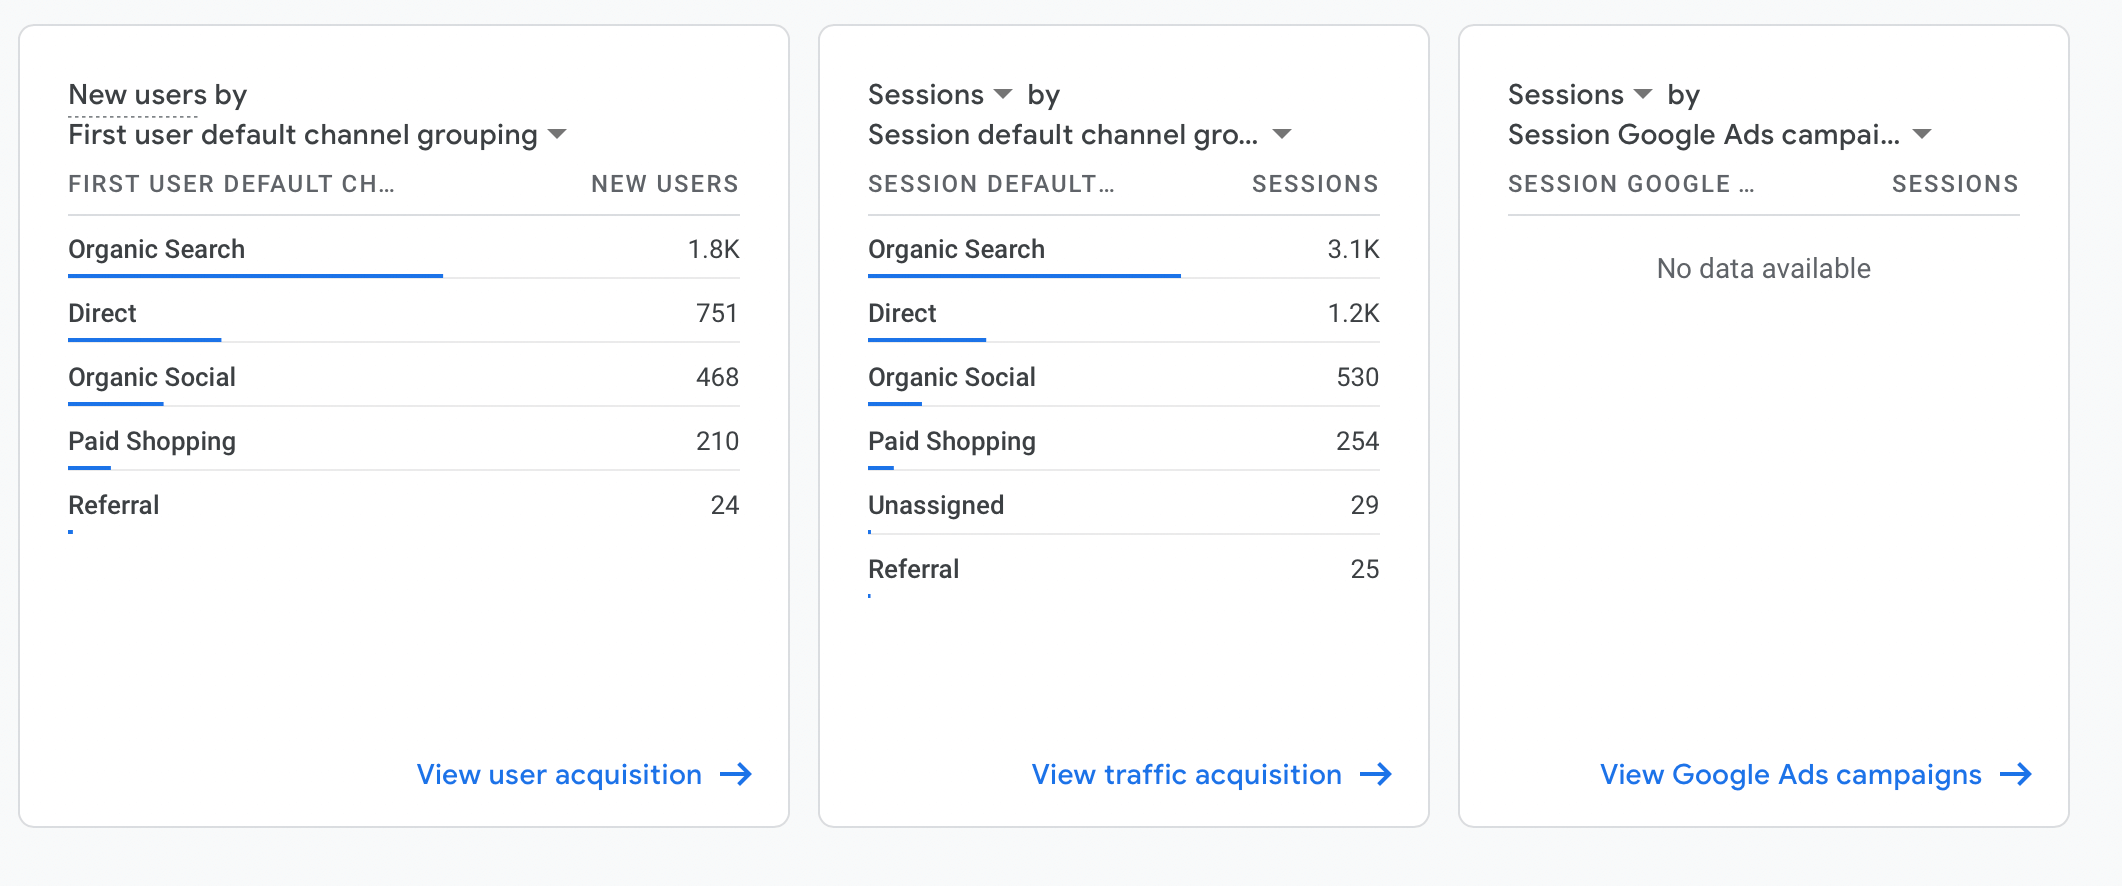
Acquisition within your analytics is important to understand as this will show your traffic sources and their value. You can locate it under Acquisition and select Acquisition overview.
- New session and sources
- Google ads - if you run any ADs you can connect to your analytics and see the performance from the dashboard and how it compares with other sources
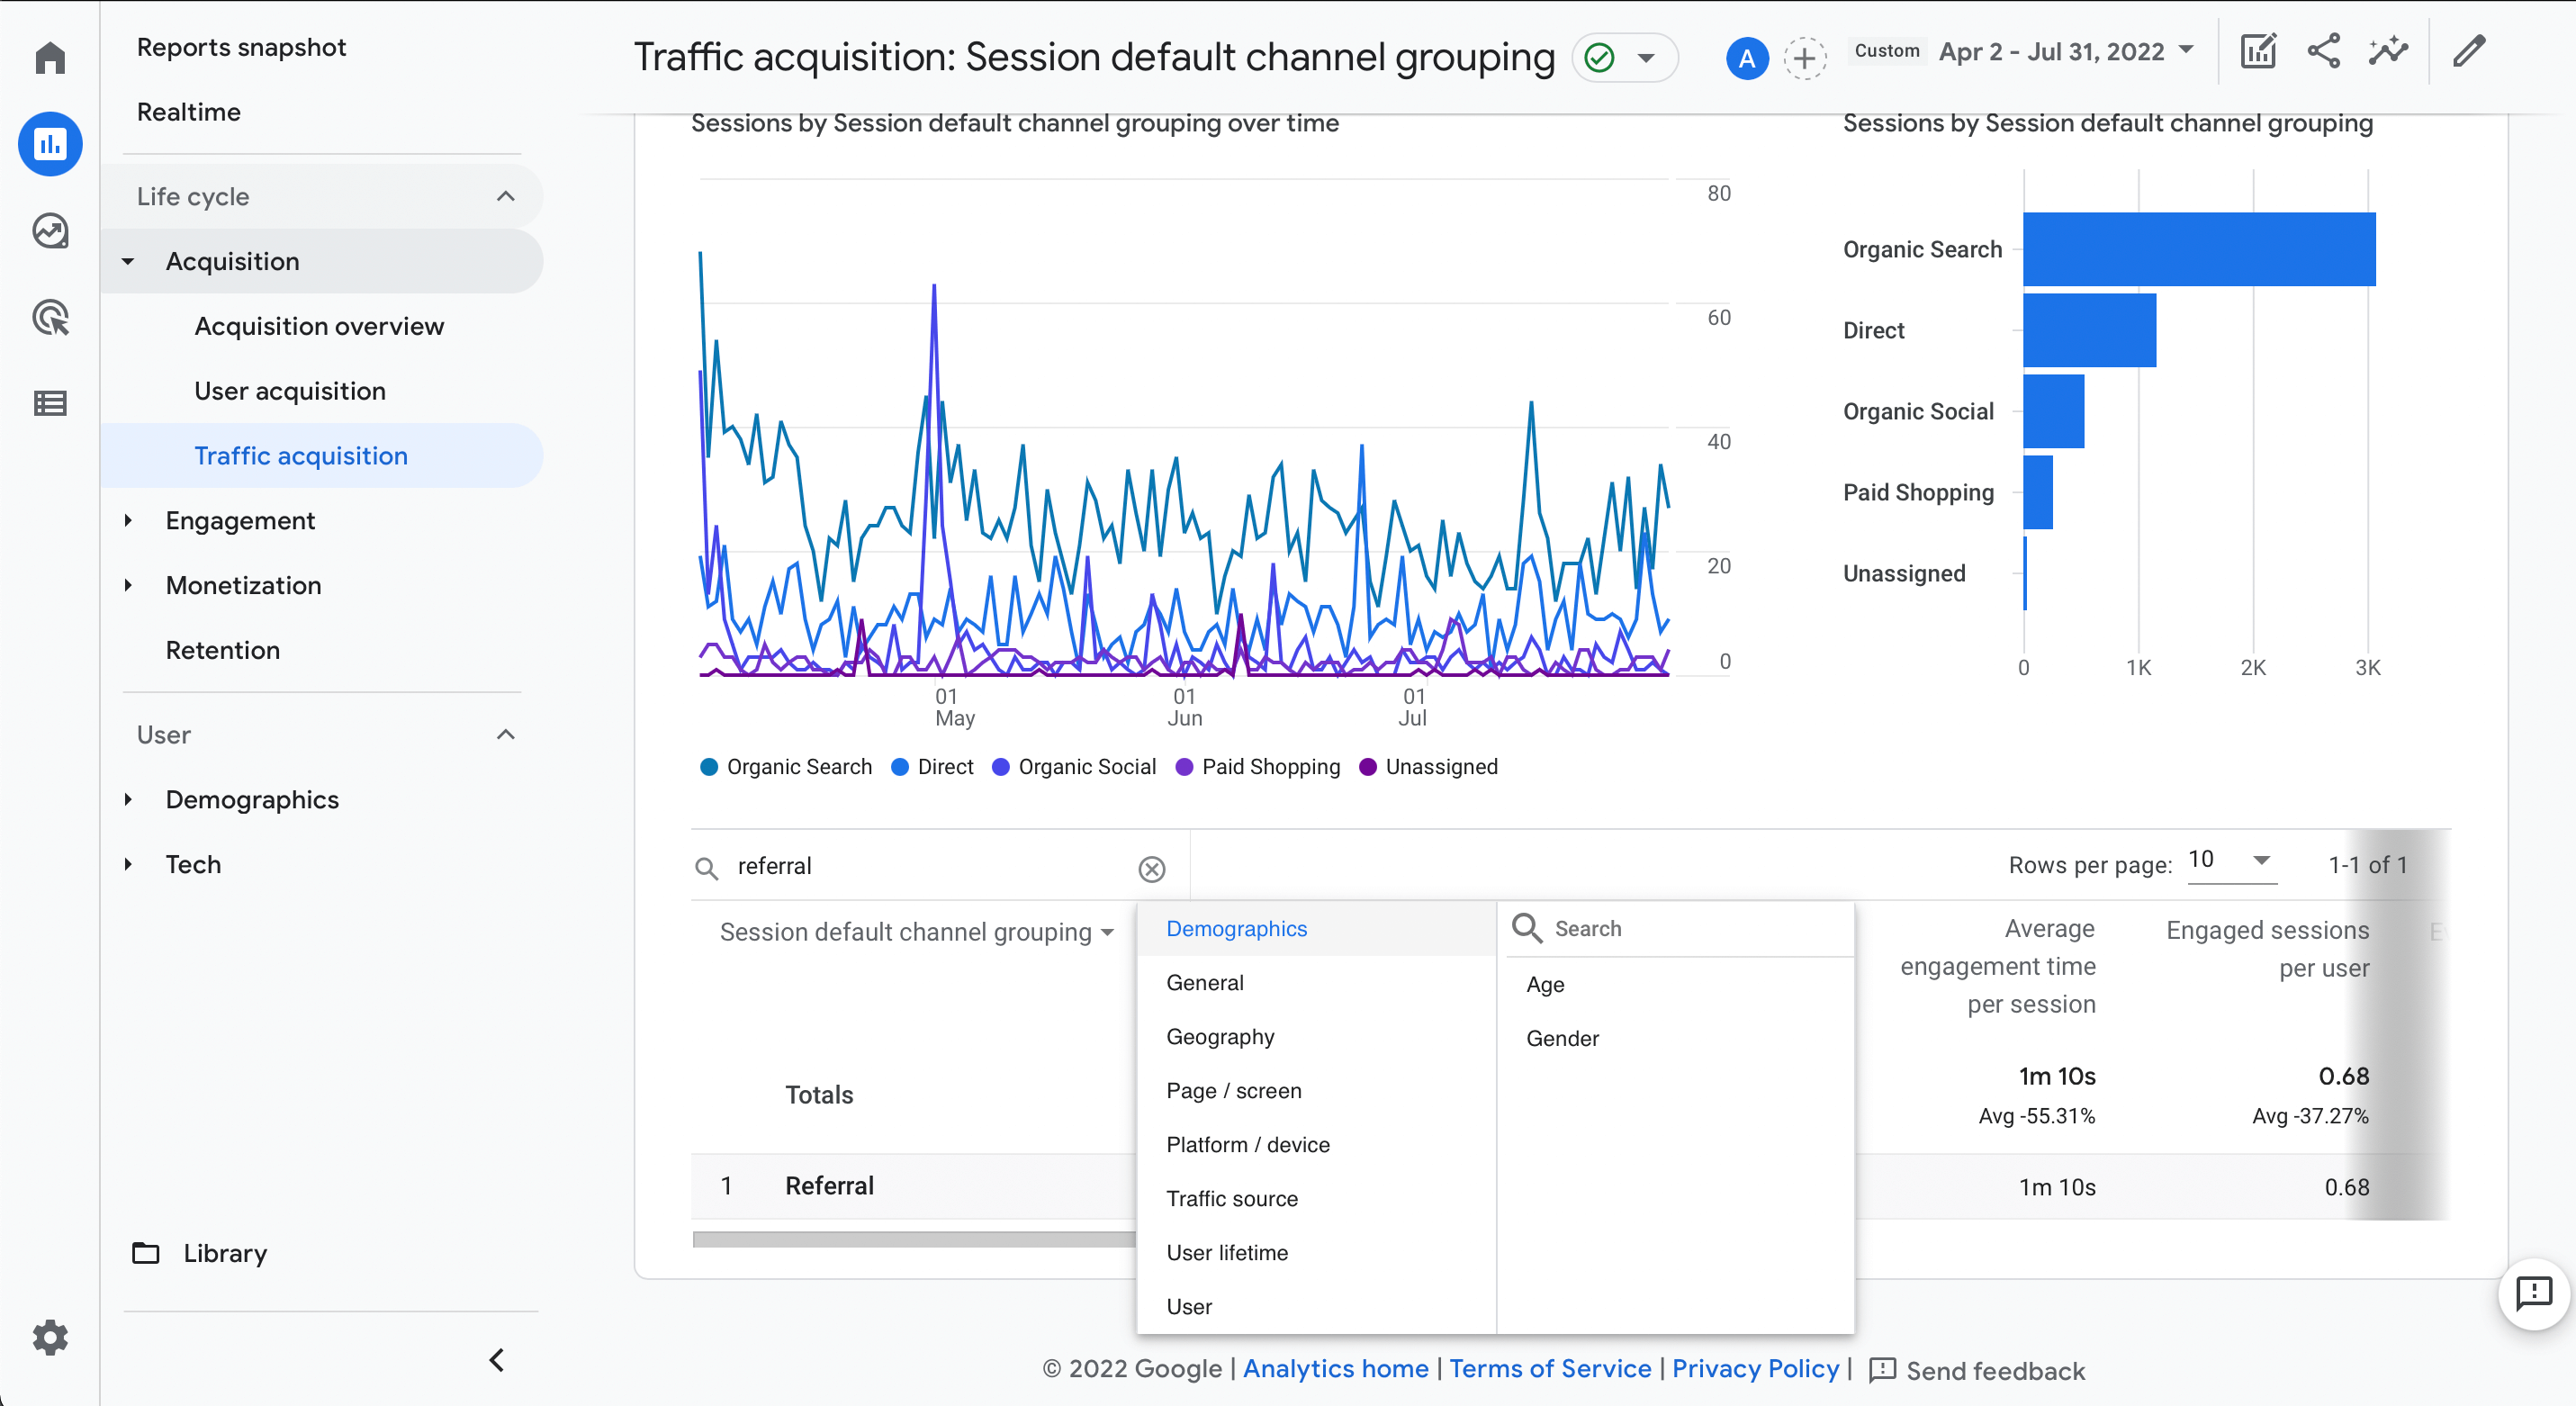
Next we have ‘Referral traffic source’
This is a great way to see if your listings and campaigns are working. Although G4 made it more difficult to use the feature, you can still see the results.
To find these results, Under reports select - acquisition - Traffic acquisition. In the box underneath, simply type in ‘referral’ to filter the referral sources. Follow these steps by then selecting referral options - traffic sources - session sources and you’ll have your list ready to check out!
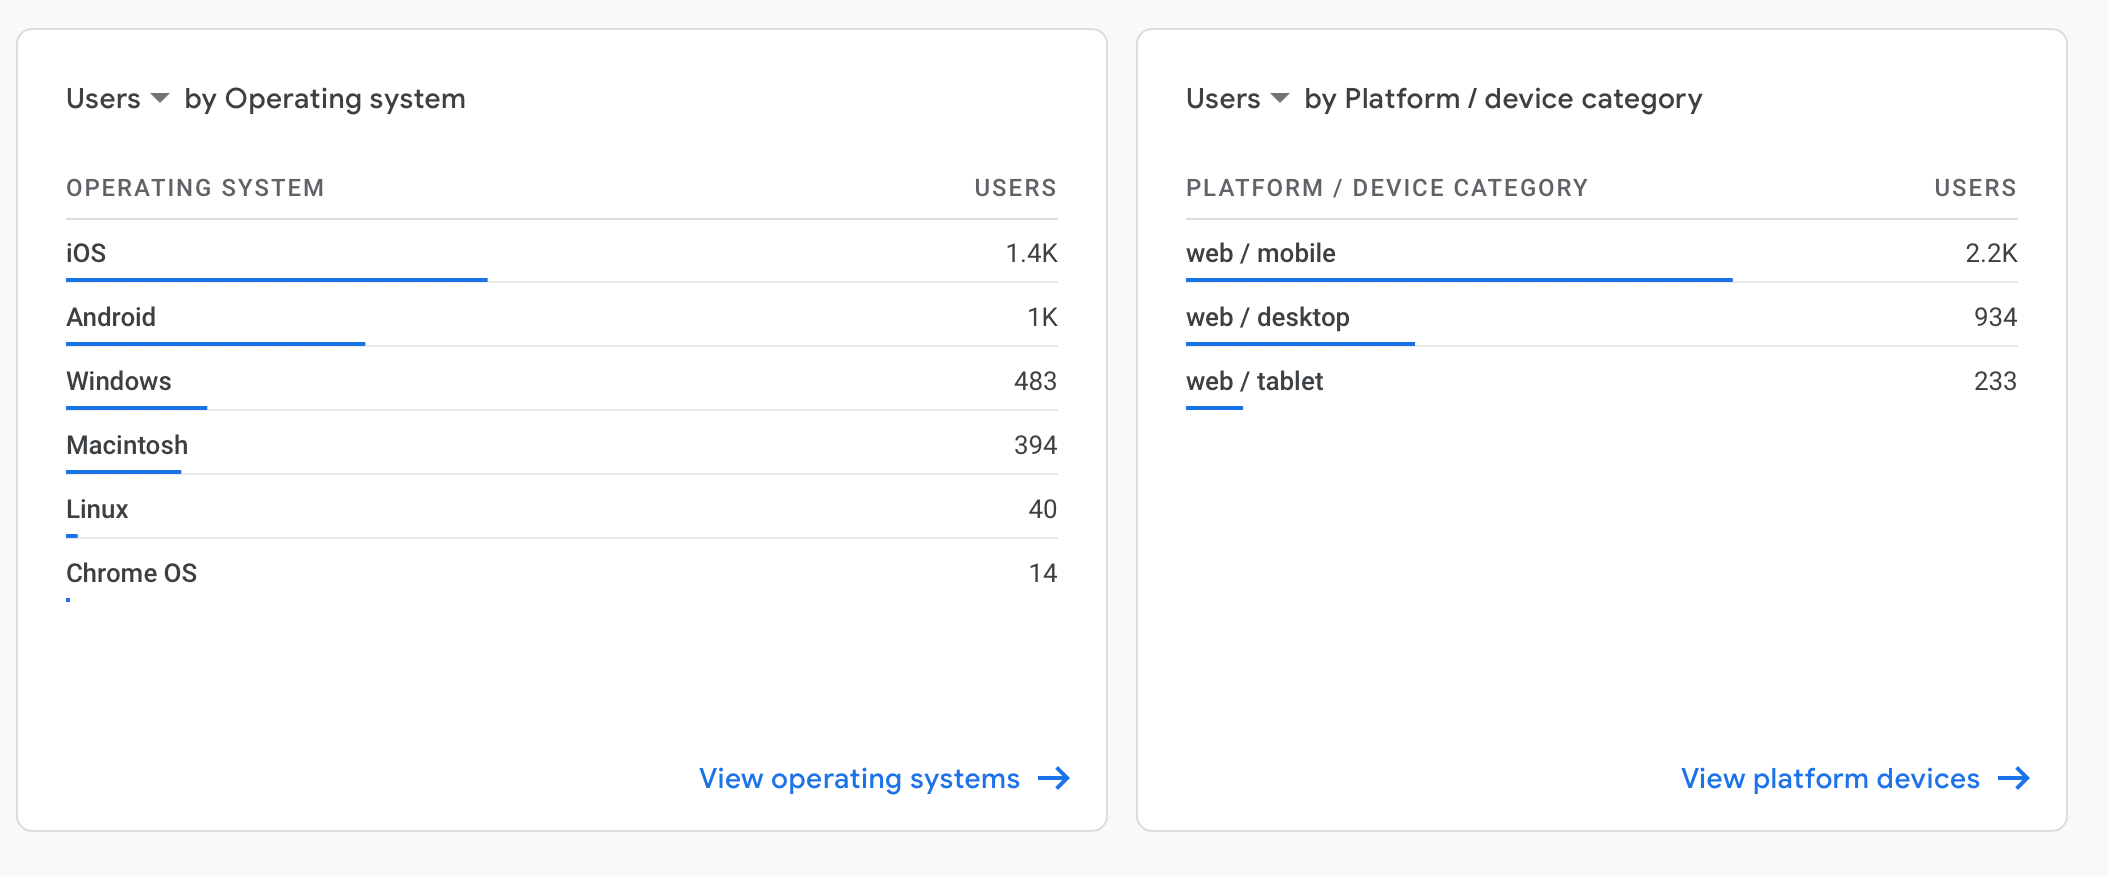
If you want to understand the most popular and most profitable user platforms for your business, The ‘tech overview’ section is for you.
This will also give you the required information to understand if you need to improve or focus on any features for specific devices.
- User operating system - helps determine device option
- Screen resolution - helps you understand and test out specific features on it
If you don’t run an e-commerce store. It’s hard to determine value from users. You can solve this with Google Tag Manager and focus on tracking leads such as contact form submissions, clicks for emailing, calling or booking.
We provide more information on how to set this up and use it effectively here - Google Tag Manager